Many factors affect the degree of contrast enhancement in human tissue. These factors can be broadly categorized as pharmacokinetic factors, which are largely controllable, and patient or equipment factors, over which technologist have little, or no, control.
Pharmacokinetic Factors
Pharmacokinetic factors include contrast medium characteristics like for example; iodine concentration, osmolality and viscosity, contrast media volume, flow rate, flow duration scan delay time and total scan time.
Contrast Medium Characteristics
One characteristics, that contrast concentration, bears further elaboration in the context of how it affects injection protocols. Although many concentrations are commercially available, most facilities use one concentration for the majority of their CT scan examinations. Higher concentration agents may be reserved for specialized studies, such as CT angiography.
Contrast enhancement depends on the iodine concentration in the vasculature or tissues. In the vessels, this concentration depends on the injection rate of iodine in mg / seconds. Therefore, a concentration of 400mg/mL injected at 3mL/seconds will provide the same total iodine as a concentration of 300mg / mL injected at 4mL/second. In spite of the relatively equal enhancement they produce, there advantages and disadvantages associated with different concentration agents.
To maintain the same vascular and organ enhancement, lower concentration of contrast medium required an increase in the injection rate and an increase in the volume this is to maintain the same iodine dose. When intravenous access is not ideal like small gauge catheter in the back of the hand, extravasation of contrast material is more likely when a higher injection rate is used. In addition, although uncommon, the increased contrast volume may impose an excessive volume load on some patients. This may be of concern in the rare instance when users make their own dilutions by adding saline solution or injectable distilled water to contrast media. Excessive dilution of contrast medial with distilled water may produce hypotonic solution, with an associated risk to the patient of edema.
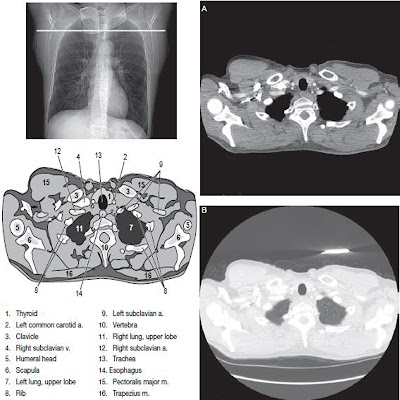
Lower concentration of contrast media may have the advantage of possessing slightly lower osmolality, which is associated with fewer adverse effects. Theoretically, lower concentration solution will produce fewer high contrast or also known as the streak artifacts in the injected vein. This is particularly important in the chest where streak artifacts are often created by dense contrast in the central veins.
 |
| High-concentration contrast media has the disadvantage of producing more high-contrast (streak) artifacts in the injected vein. This is particularly important in the chest where streak artifacts are often created by dense contrast in the central veins. Image courtesy of the University of Michigan Health Systems. |
Some mechanical power injectors offer the ability to inject contrast and saline simultaneously as a means of decreasing the streak artifacts and optimizing the image quality, while still delivering high density contrast to the area of diagnostic interest.
In comparison, injecting a higher concentration agent at about more or less 325mg of iodine per mL, will deliver the same amount of iodine at a lower flow rate. The same or higher the flow rate provides a concentration bolus that is well suited for examinations with a short scan duration like in CT angiography, particularly when multislice CT scanner are used.
The viscosity of a contrast agent increase with its iodine concentration. Prewarning of the contrast material to body temperature can help to reduce the viscosity so that it can flow more easily through in dwelling intravenous catheter. The value of a saline flush is increased when higher concentration contrast media are used because the more viscous the contrast medium will remain longer in the venous injection path.
Contrast Media Volume, Flow Duration, Flow Rate
As the CT scanner technology evolved from axial slice scanning to SDCT to MDCT, scan duration has dramatically decreased. This increased speed has had an impact on the volume of contrast media used for typical CT studies. When scanners were slower, a larger volume of injected contrast served to extend the flow duration and expand the window of opportunity for acquiring scans while tissues were optimally enhanced. Shorter acquisition time often allow the contrast volume to be reduced. The degree to which contrast volume can be decreased depend on the study, however. Whether, and how much, contrast volume can be cut during liver imaging is controversial. A certain amount of iodine is needed to achieve adequate parenchymal enhancement; dropping below that volume will reduce lesion to be easily seen.
The rate that contrast media is injected largely determines the time needed for it reach the peak enhancement and will influence how dramatically enhancement falls off once this peak is reached. The effects of varying these factors are more pronounced for aortic enhancement then for hepatic enhancement. The consequences of varying contrast dose ‘determined by contrast volume and concentration’ and flow rate can be graphically depicted using a time density curve. The ‘I” axis of the graph depicts the time elapsed in seconds, after the start in injections, whereas the ‘Y’ axis chart the relative enhancement levels achieved, in Hounsfield units.
Computer simulations and porcine models help to isolate the consequences of varying specific injection parameters. The time delay curves included in this section are intended to illustrate the relationship between contrast medial dose, injection flow rate, scan delay and scan duration.
The rate which contrast media is injected and the volume of contrast used significantly affect the time needed for the contrast to reach peak enhancement. These effects are more useful for aortic enhancement than for hepatic enhancement. Therefore, correct injection parameters, particularly scan delay, are more important for CT angiography than for routine body imaging.
The picture A below the time density curves demonstrate the effect of varying contrast dose like maintaining concentration but increasing volume’ on aortic enhancement.
 |
| The time-density curves demonstrate the effect of varying flow rate on aortic |
While on picture B. In this simulation both the flow rate and iodine concentration were held constant. The graphs compare the enhancement achieved after 3 injection volume, 75mL, 125mL, and 175mL. We see that for a constant injection rate, as the contrast dose is increased ‘by increasing contrast volume’, the magnitude of the peak enhancement increase and the time required to reach that peak also increases. Furthermore, for any given level of desired enhancement, that level is maintained longer as contrast volume increases.
 |
| Hepatic contrast enhancement (CE) when different flow rates are used. For a constant volume and concentration of contrast media, as the flow rate is increased, there is a decrease in the time to peak aortic enhancement. |
The time density curve in picture below illustrate the effect on aortic and hepatic enhancement, when different flow rate are used. For a constant volume and concentration of contrast media, as the flow rate is increased, there is a decrease in the time to peak aortic enhancement. In practice, this means that the scan delay must be adjusted according to flow rate. For a constant volume of contrast media, increasing the flow rate shortens the duration of the contrast injection. It should be clear that to capture optimal vascular enhancement for CT angiography studies, the scan timing must be correctly mark. Image acquisition that is too late will miss the contrast bolus, whereas scanning too late may not provide adequate opacification, particularly the small vessels.
Manipulating the flow rate during an injection can improve the likelihood of scanning during optimal vascular enhancement. Manipulating the flow rate to change the characteristic of the time density curves is sometimes called bolus shaping. The typical time density curve for aortic enhancement using a single injection flow rate (uniphasic), such as that depicted by the black line in the graph as depicted below is not ideal for CT angiography.
 |
| Typical time-density curves for aortic enhancement using a single injection rate result in a single peak of aortic enhancement that is greater than necessary, but of a very short duration (black line). |
A uniphasic injection results in a single peak of aortic enhancement that is generally much greater than necessary, but of a very short duration. Ideally, injection techniques would achieve an adequate level of aortic enhancement and then maintain that level for a longer period of time, depicted by the blue line in the graph below.
 |
| Ideally, injection techniques would achieve an adequate level of aortic enhancement and then maintain at that level for a longer time (gray line). This would allow the scan timing to be less precise. |
This would increase the window of opportunity for CT scanning, allowing the scan timing to be less precise. This is particularly useful when using a slower scanner, when using very narrow collimation, or when scanning a longer area. In addition, more uniform vascular enhancement is beneficial for post processing. In practice, bolus shaping is accomplished by beginning the injection with a relatively high flow rate and then decreasing the flow rate throughout the remainder of the injection period.
Biphasic and Multiphasic Flow Rates
When two flow rates are used the technique if often referred to as biphasic and when more than two flow rates are used the technique is referred to as multiphasic. Often the final rate is to deliver a saline flush. This allow the entire volume of contrast media to be used as the saline flush forward any contrast that remains in the injection veins. In some instances bolus shaping can allow a reduction in contrast volume. This is possible when it is used with a fast scanner or when the scan area is relatively limited. However, for most clinical application a uniphasic contrast injection with a constant flow rate is sufficient.
For most clinical application a uniphasic contrast injection with a constant flow rate is sufficient.
Although considerably less pronounced, many of the same principles apply to hepatic enhancement
 |
| Time-density curves demonstrate the effect of varying contrast dose on aortic (A) and hepatic (B) contrast enhancement (CE). |
 |
| The time-density curves demonstrate the effect of varying flow rate on aortic (A) and hepatic (B) contrast enhancement (CE) when different flow rates are used. For a constant volume and concentration of contrast media, as the flow rate is increased, there is a decrease in the time to peak aortic enhancement. |
That is, increasing the dose will increase the magnitude of the hepatic enhancement and increasing the flow rate will shorten the time to peak enhancement. However, compared with aortic with aortic enhancement the slope of the contrast timing curves for hepatic enhancement is less steep with a longer horizontal portion during which contrast enhancement remains relatively constant. In practice this allows a wider window of opportunity for scanning; therefore, the timing of scans for routine abdominal imaging does not need to be as precise as those designed to capture peak aortic enhancement.